In August 2022 I spent three weeks sampling rivers in six fjords in the southernmost part Greenland, covering a range from the towns of Narsarsuaq to Nanortalik. For this SPI Fieldnotes post I’ll briefly introduce my project’s goals, describe the day-to-day activities, and highlight what was key to making this trip a success.
Goals: To characterise the distributions of contaminant and nutrient metals in rivers
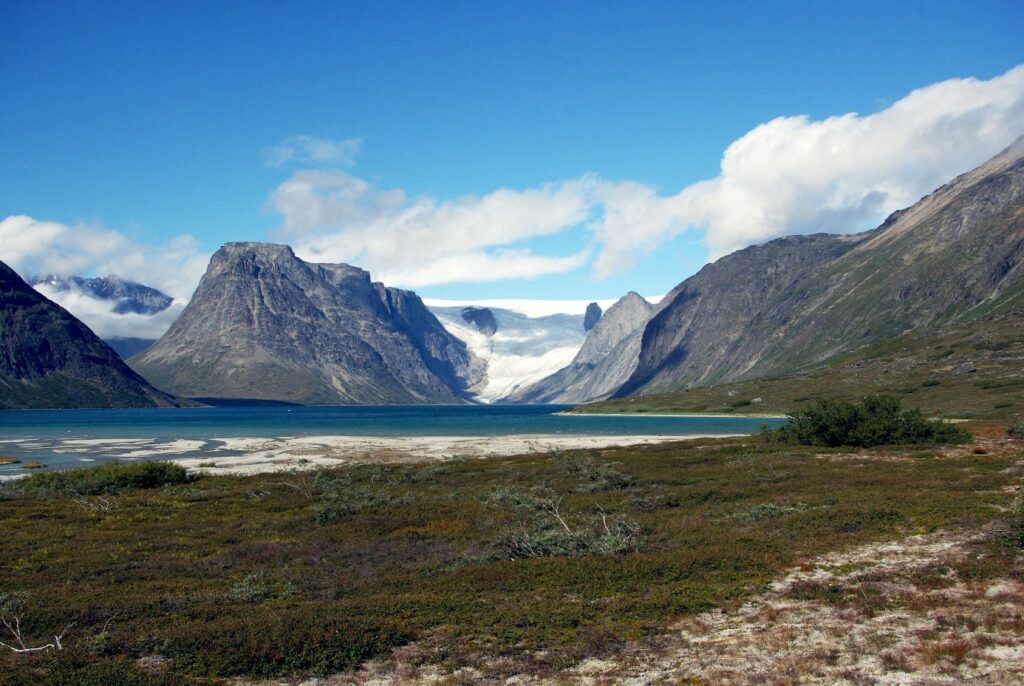
The motivation for this project came from previous research by others in Greenland showing high fluxes of nutrients and contaminants from the Greenland ice sheet, as well as research showing elevated loads of contaminant metals resulting from mining operations in the Canadian Arctic and Greenland. These prior studies have largely been based in the west and the north of Greenland. As the southernmost part of Greenland has much less data coverage, we targeted South Greenland for our pilot project. Our sampling sites covered a range of settings – from tundra to glacially-dominated rivers, and in catchments with known metal deposits, land transformed through human use (e.g. farms), and sites without such influences. This range will help us to assess the controls on metal concentrations in rivers, and the potential mobilisation of natural metal enrichments found throughout South Greenland.
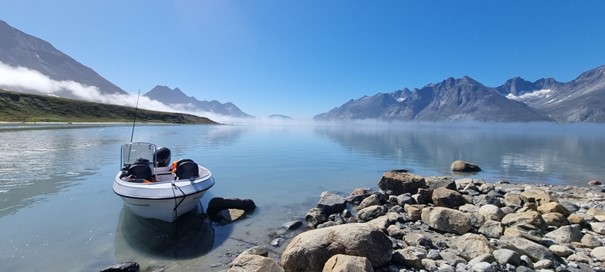
Photo credit: © 2022 Coralie Delarue, all rights reserved
Day-to-Day Activities
Based out of the towns of Alluitsup Paa, Nanortalik and Qaqortoq, each respectively at the southern (ocean-ward) side of their fjords, our day-to-day work involved loading our gear into a small boat and heading north into the fjords. One of three local boat drivers guided us, and would drop off the field team (myself and an assistant, plus 2-3 colleagues working on their own projects) as close as possible to river mouths. This was often not as easy as it sounded. Sediment carried by the rivers accumulates at river mouths, making these too shallow for access but too deep to hop out of the boat without hip waders, so we had to aim for the shoreline to either side, watching for rocks and working with the tide and any small waves to get a safe landing and exit. When we found a suitable spot – almost always where we could keep our feet dry when getting out – we would hop off, unload a field box, and hike to the river.
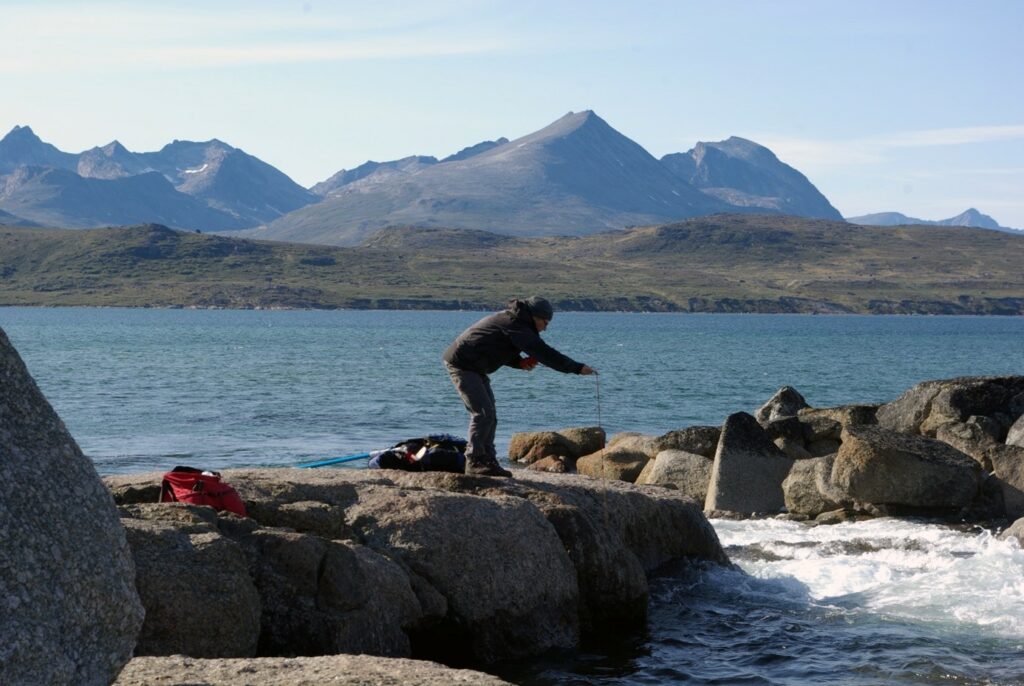
My team of two would then conduct CTD measurements (for water conductivity, temperature, and depth) and collect water samples using a telescoping pole and a 3D printed bottle holder. We would then hike back to our landing point where we had left our field box to filter the samples for our various analyses and those of our collaborators (dissolved and particulate metals, major ions and other general water characteristics, different forms of dissolved carbon, and mercury). This filtering usually took about 45 minutes to one hour. Then we would climb back in the boat and head toward the next river. Depending on the weather, boat travel and hiking distances, and how easy the water was to process (i.e. how much sediment was clogging our filters), we could sample up to four rivers per day. Back at our home base, we cleaned our equipment, finished our notes from the day, organised samples, and prepared the plan and the gear for the following day. This required improvising a bit of ‘lab’ space (below).
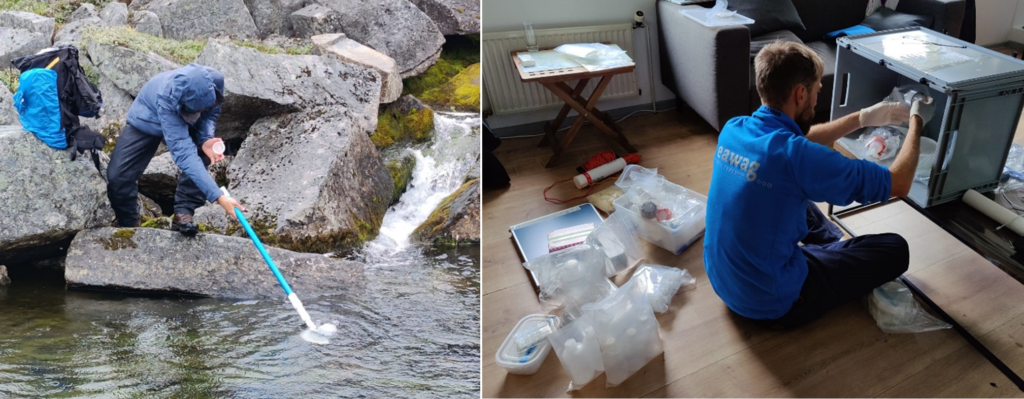
Photo credits: © 2022 Karin Beck, all rights reserved
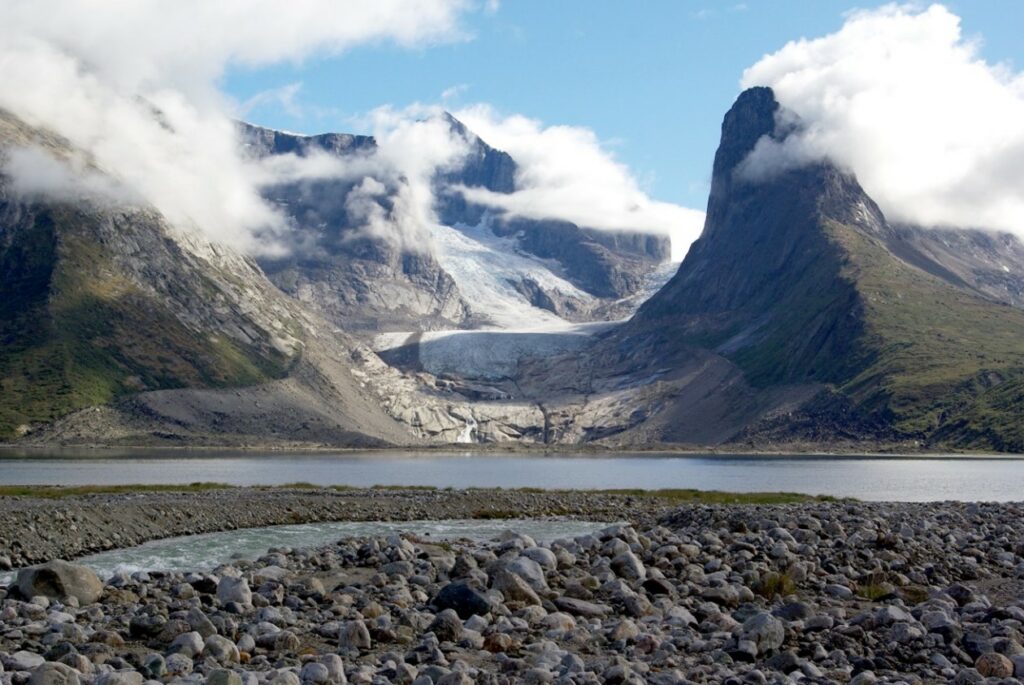
Photo credit: © 2022 David Janssen, all rights reserved
I’ve spent nearly 9 months of my life at sea, spanning from the Arctic to the Antarctic, and the Pacific, Indian and Atlantic Oceans, and most of my life based in seaside cities. This prepared me for living with a clear connection to the water. But I can say, even with this trip where we spent every night and all the sampling on land, I’ve not had the connection to life on the water as I did in these three weeks. Water was our scientific target, but also the road connecting our sampling sites and the soundscape of our days. As we operated from small boats, the tides, wind and sea state controlled our activities – some days we felt each wave not only in the motion of the boat, but also in the spray on our faces. And one can also clearly see the importance of water for everyday life – from the activity brought in from the fish processing plant at the harbour of Nanortalik, to the impact of the closure of the processing station in Alluitsup Paa, to the change when a major cruise ship arrives in town for the day, and then leaves again at night. This connection was a powerful feeling from the trip that I will remember.
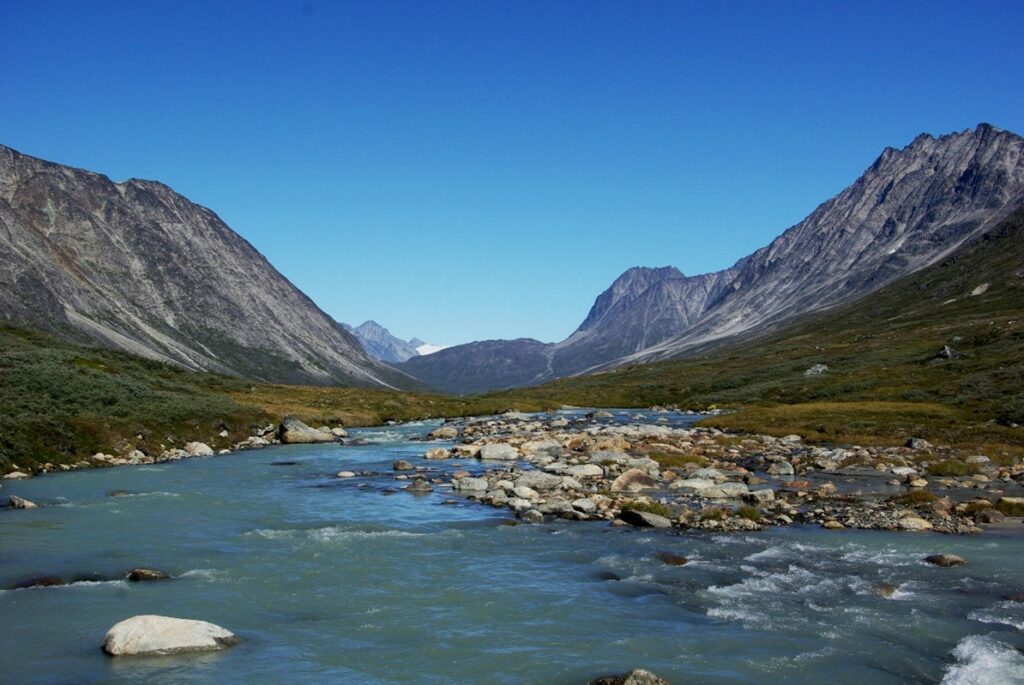
Photo credit: © 2022 David Janssen, all rights reserved
Keys to Success
The main key to our success were our collaborators with local knowledge. Whether it was colleagues at Eawag who have worked in Greenland for many years or our local boat drivers who knew the region, pairing with people who were familiar with the area made it possible for us to do what we wanted. It can’t be overstated how fundamental this was to my success, and it would not have been possible to conduct this project without their support – thanks to Jakob, Coralie, Grég, André, Minik, Henrik, David & Lorenz (and many others who assisted and gave advice)!
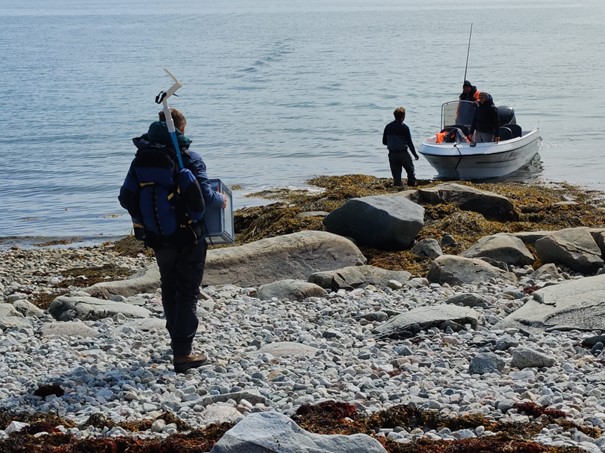
Photo credit: © 2022 Karin Beck, all rights reserved
With this major piece in place, my team’s research plans and the associated logistical needs were designed to prioritise ease of mobility in the field – we could fit all we needed for a day of work (plus food, water and safety gear) in two backpacks and a box. This enabled us to get in and out of the boat easily with all our gear when landing sites weren’t ideal, and allowed us to move a bit further in the field to reach our sites when needed. It also helped us to maximise what we could sample from a limited number of field bases, where the rest of our gear could be stationary. Finally, the simplicity of our sampling strategy and needs, combined with a redundancy in equipment (3D printed parts, in-situ sensors, different filtration mechanisms and filter types) and on-site expertise (thanks especially to Karin & Carsten) allowed us to solve the problems that inevitably arise in any field expedition.
Current state of the project
After a great three weeks in the field, we’re now busy going through data and finishing up last of lab work. All our main samples have been measured and we are looking forward to putting all the information together!
David Janssen is Group Leader at the Department of Surface Waters at EAWAG. His field trip took place in August 2022 with the financial support from an SPI Exploratory Grant.
Header photograph: The glacier at the north end of the Tasermiut Fjord. Photo credit: © 2022 David Janssen, all rights reserved