- Home
- >
- Expeditions
- >
- Antarctic Circumnavigation Expedition (ACE)
- >
- ACE data
- >
- ACE Data Collection
Data collected

Over 20 terabytes (TB) of data were collected during the expedition. This is not a volume to be underestimated: it is approximately equivalent to the amount of data held on 4,500 DVDs, or enough music to listen to for 40 years! We are expecting to produce around 100 TB of data by the time we have fully processed and analysed the data.
Scientists on board were studying everything from the ocean, to the atmosphere, to what could be found on islands, therefore there was an enormous diversity in the data collection as well. Some data were collected by automated instruments, measuring properties of the atmosphere and sea water continuously. Other instruments were used to collect data at certain locations or when conditions were just right. Over 160 different instruments were used during the expedition. Read more about what data were collected on the science pages.
Samples collected
In addition to data, scientists collected over 27,000 samples. A large proportion of these were water samples, from both the surface of the ocean, but also regularly down to a depth of 1,000 m. These are being studied to understand the chemical and physical properties of the water, but are being carefully studied under microscopes to find microscopic creatures and even small pieces of plastic. Air samples and snowflakes were also collected whilst at sea. On the islands, samples of ice, snow, soil, rocks, plants and invertebrates were collected to further our understanding of these remote and rarely-visited locations. Scientists around the world are now working hard to process these samples and turn them into data.
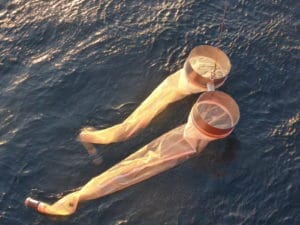
Nets used to collect microplastics from the surface of the water Scientists collated information about what was deployed or sampled, by whom, when, where and by which instrument amongst other information, then entered it into a database to give more context to the samples and data.
A system to regularly backup data onto the expedition’s central system and visualise it in real time was also setup during the expedition. This system is open-source and the code can be found here.
Cruise report
More details about the work on-board can be found in this detailed report:
David W H Walton, & Jenny Thomas (2018). Cruise Report – Antarctic Circumnavigation Expedition (ACE) 20th December 2016 – 19th March 2017 (Version 1.0). Zenodo.
Images by J. Thomas